Monitoring Tangle Node
The following is a guide outlining the steps to setup monitoring for an Tangle node. If you do not have Tangle node setup yet, please review the How to run an Tangle node setup guide here (opens in a new tab). It is important to note that this guide's purpose is to help you get started with monitoring your Tangle node, not to advise on how to setup a node securely. Please take additional security and privacy measures into consideration.
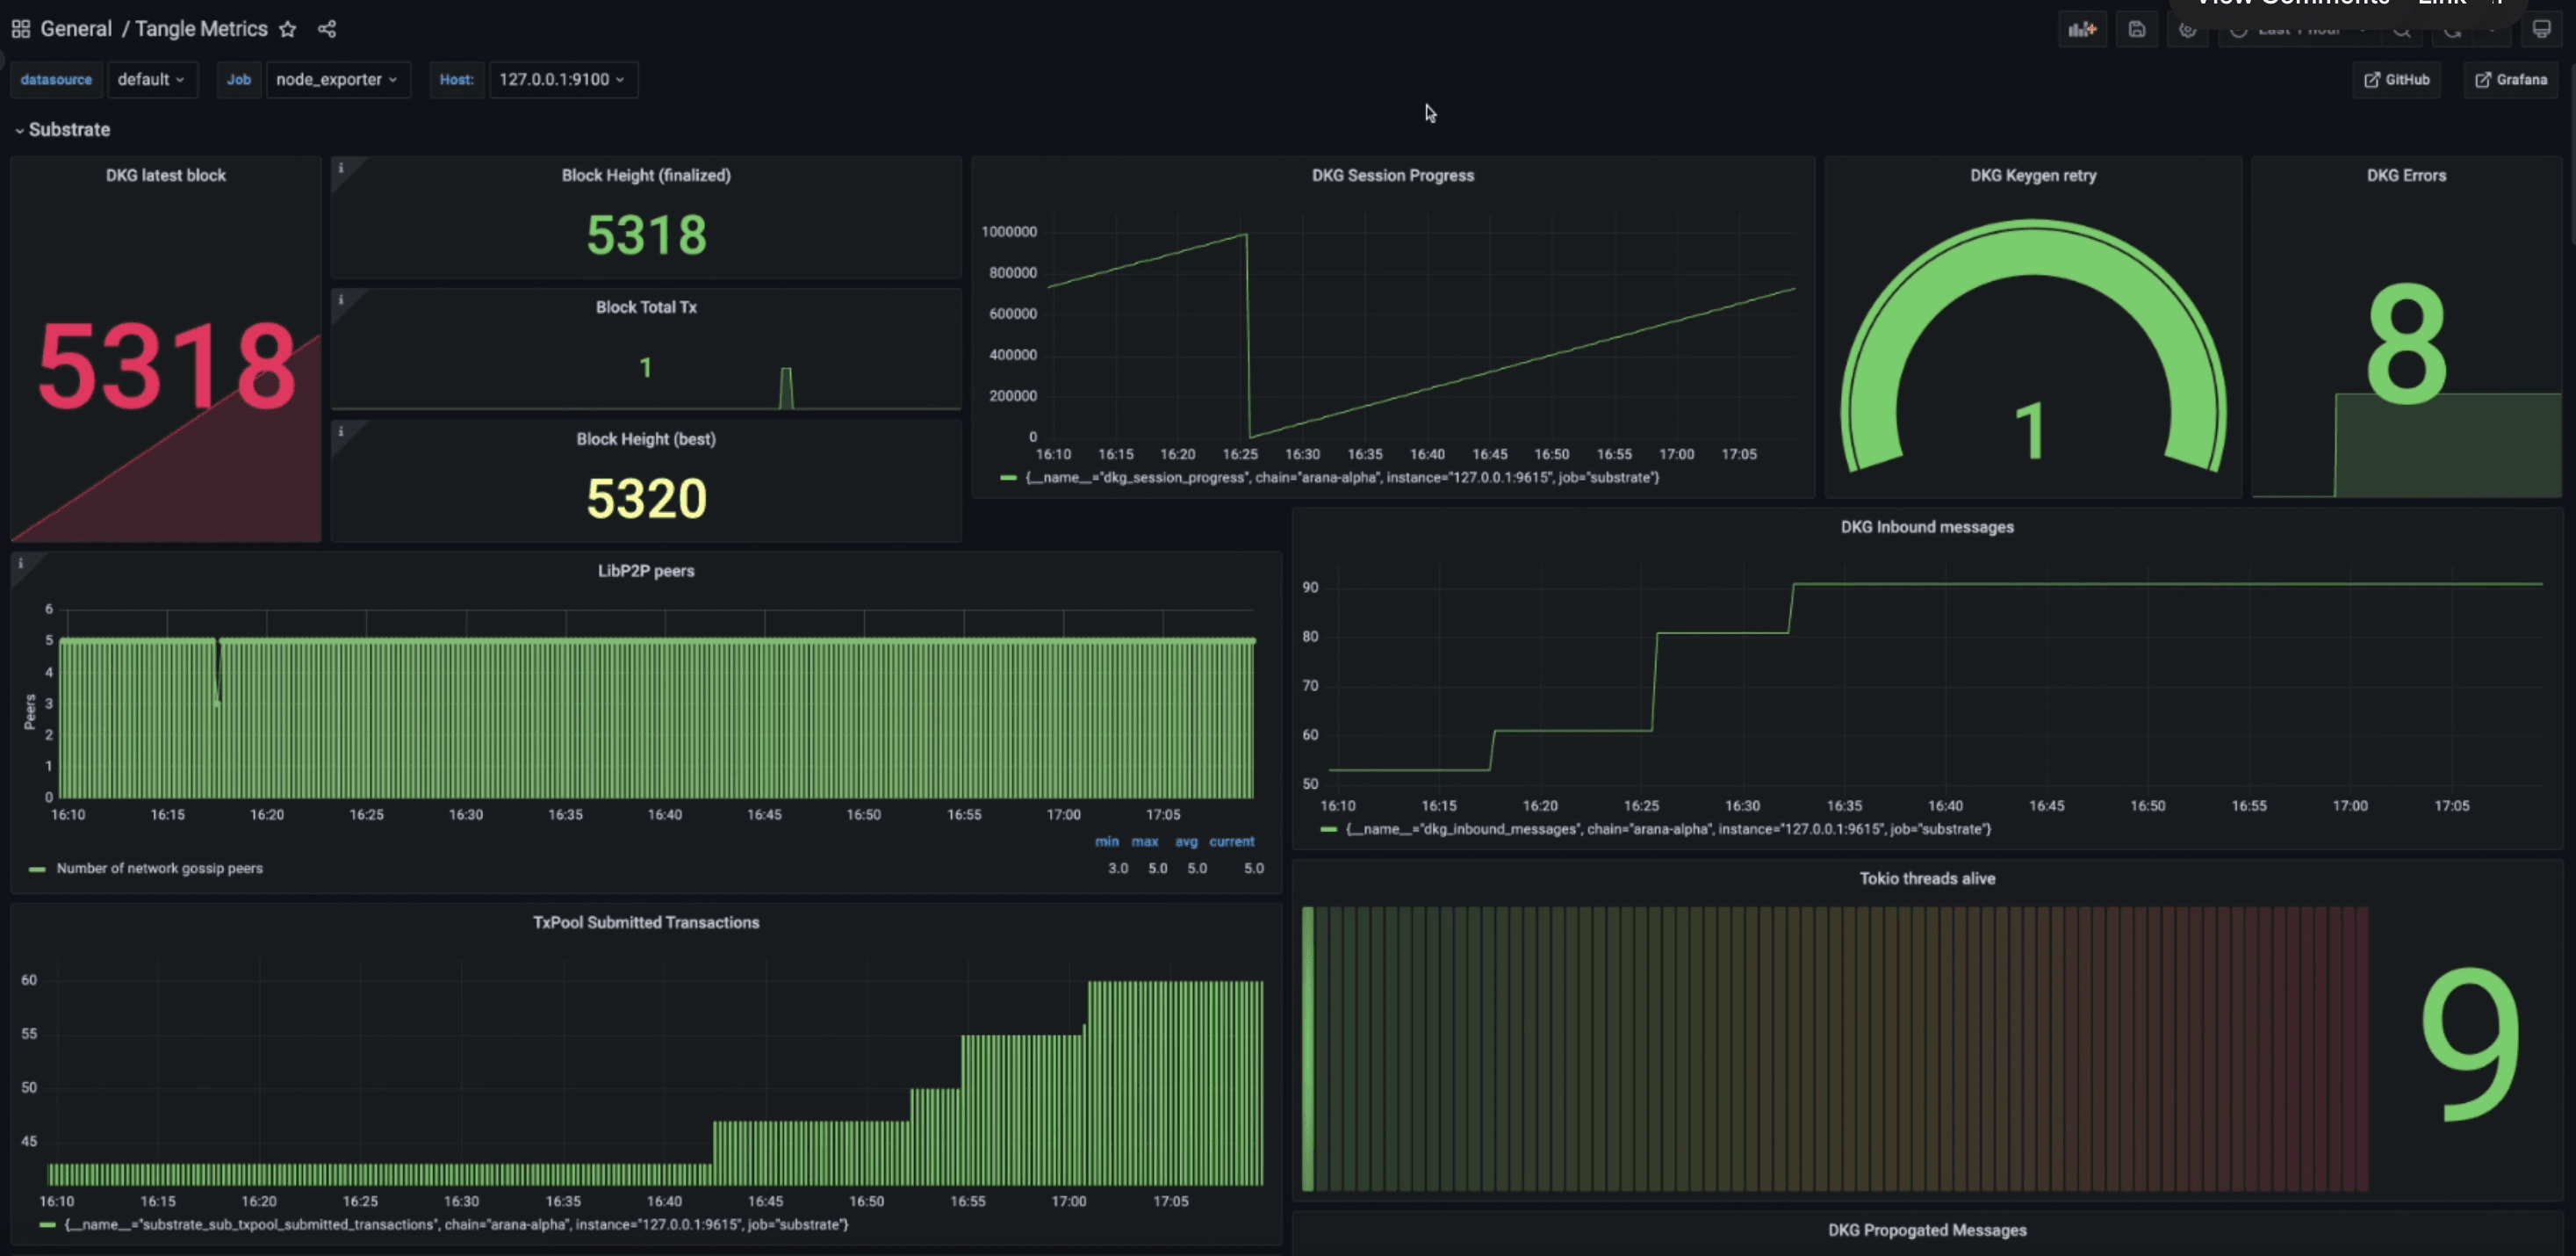
Here is how our final configuration will look like at the end of this guide.
- Prometheus is the central module; it pulls metrics from different sources to provide them to the Grafana dashboard and Alert Manager.
- Grafana is the visual dashboard tool that we access from the outside (through SSH tunnel to keep the node secure).
- Alert Manager listens to Prometheus metrics and pushes an alert as soon as a threshold is crossed (CPU % usage for example).
- Tangle Node natively provides metrics for monitoring.
- Process exporter provides processes metrics for the dashboard (optional).
- Loki provides log aggregation system and metrics.
- Promtail is the agent responsible for gathering logs, and sending them to Loki.
Running the monitoring stack requires that you are already running the tangle network node with at least the following ports exports:
- Prometheus :
https://localhost:9615
Docker usage
The quickest way to setup monitoring for your node is to use our provided docker-compose file. The docker image starts all the above monitoring
tools with the exception of Node exporter. node-exporter is ommitted since some metrics are not available when running inside a docker container.
Follow the instructions here (opens in a new tab) to start the prometheus node exporter.
Prerequisites
Before starting the monitoring stack, ensure the configs are setup correctly,
- (Optional) Set the
__SLACK_WEBHOOK_URL__inalertmanager.ymlto receive slack alerts - Ensure the promtail mount path matches your log directory
Note : All containers require connection to the localhost, this behaviour is different in Linux/Windows/Mac, the configs within the docker-compose and yml
files assume a linux environment. Refer this (opens in a new tab) to make necessary adjustments for your environment.
Usage
To start the monitoring stack, run:
cd monitoring
docker compose up -d
You can then navigate to http://localhost:3000 to access the Grafana dashboard!